AI Pie Chart Generator
Turn raw data into a clean chart with fast help from Edubrain.
AI Pie Chart Generator That Makes Data Easier to Present
Turn Data Into a Chart Fast
Just paste your numbers, and you can immediately see the chart. Then, tweak the title, labels, or colors as you please without having to start from scratch every time.
More Than One Chart Style
Choose a standard pie chart, try a donut chart, or switch to another visual format. You are not forced into one layout when the data needs a different view.
Personalize Your Style
Updating labels, titles, and font styles is completely hassle-free. It’s easy to fine-tune the design until it fits the rest of your project perfectly.
Works With Real Files
Paste data, upload notes, or work from documents like PDF, CSV, or Excel. The tool reads the values, fills the chart, and helps you build graphs without extra manual work.
Refined Insights From Raw Data
Some data makes sense in rows and columns, but not at a glance. This pie chart maker transforms that information into something easier to read, present, and explain.
Ready for Reports and Slides
The final chart is easier to save, download, and place into reports, slides, or infographic-style work. That makes it useful for school, work, and client-facing materials.
No Design Skills Needed
There's no need to mess around with any complicated software or technical setups. Just throw in your data, hit generate, and then you can easily make those small final tweaks until it's perfect.
How to Build Your Chart


Featured in
Why use EduBrain.ai
- Create clear pie charts from raw data in just a few clicks
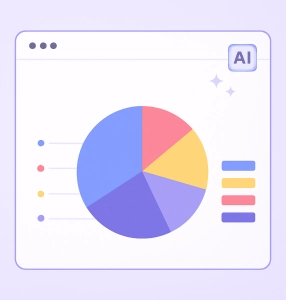
EduBrain AI pie chart generator turns plain numbers into a clean visual representation. Add your data, and the chart appears right away. Every slice takes the right color and size, based on your values. You can use the free pie chart maker to create as many graphs as you need for any project.
- Explore all diagram styles
Switch between flowchart, mind map, pie chart, radar, sequence, or timeline. EduBrain tool changes the layout by itself. Every format stays clear and keeps the message in place.
- Add your PDF or note to build a chart
Upload a PDF, summary, or class note. The AI pie chart generator reads the text and shapes a chart from it. The fields fill by themselves, so no extra typing stands in the way.
Why People Keep Using It
Choose your plan
Free plan
- Unlimited use with ads included
- Free access to all AI tools
- Download all responses (answers, presentations, flashcards, etc.)
- Share responses with others
AI-Plus
- Expert reviews on discounted prices
- Ad-free experience to:
- AI detector
- Diagram generator
- PowerPoint generator
- Answer generator
- Flashcard maker
- Notes generator
- Research assistant
- Download all responses (answers, presentations, flashcards, etc.)
- Share responses with others
- Advanced reasoning
Expert help
- Presentations (human-made)
- Homework help
- STEM support
- Writing assistance
- Editing & proofreading
Check Out Other AI Tools


