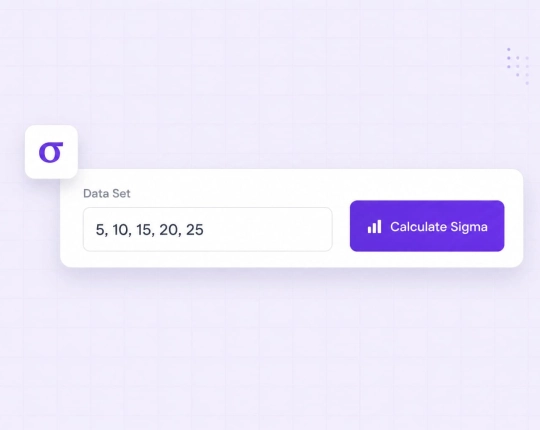
Standard Deviation Calculator
Understand Your Data Distribution Faster
Quick statistical analysis
You can compute the standard deviation of any data set in a few seconds, rather than going through a complicated formula.
Supports sample and population data
The tool handles both sample standard deviation and population standard deviation without confusion.
Clear breakdown of results
Outputs include mean value, variance, and squared differences, so you see how each number affects the result.
Useful across disciplines
From finance to science, the calculator fits many use cases. In case you want to elaborate further, there is statistics homework help.
How to Use the Standard Deviation Calculator


Featured in
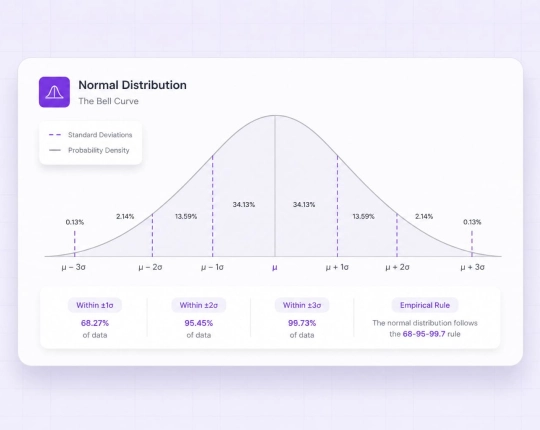
What Is Standard Deviation?
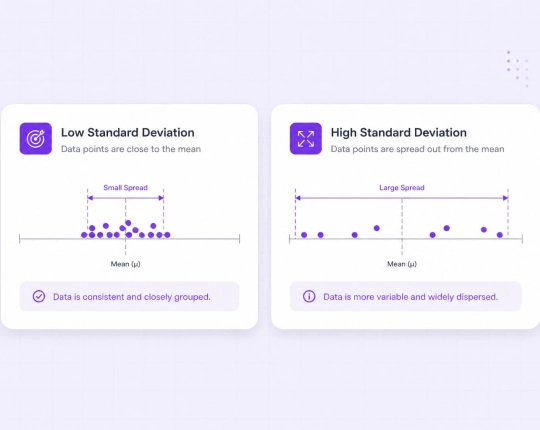
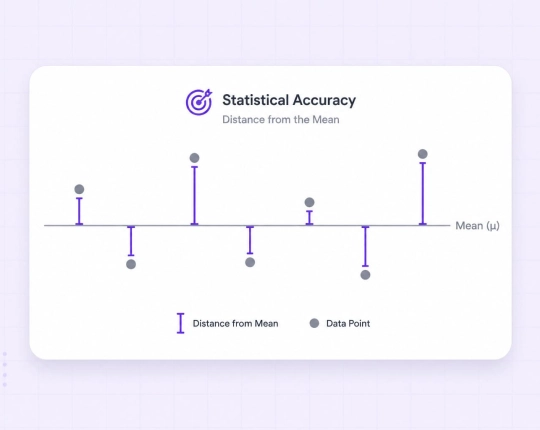
Standard deviation defines the extent to which the individual data values differ from the average value. When the standard deviation is small, the values of the data remain near the mean value, whereas when the standard deviation is large, the data values are more spread out. All standard deviation calculators are applied with the same principle: they are measures of dispersion of a data normal distribution. This renders it one of the most valuable statistical tools.
Population Standard Deviation vs Sample Standard Deviation
A distinction exists between population and sample calculations.
- Population standard deviation: Used when your data represents the entire population. The formula divides by \(N\).
- Sample standard deviation: Applied when working with sample data taken from a larger population. The formula divides by \((n – 1)\), known as Bessel’s correction.
Explanation of the Standard Deviation Formula
The standard deviation equation is a procedural formula:
- Calculate the mean, minimum, and maximum value
- Take the mean of each of the data values.
- Square each difference
- Calculate the mean square difference (variance).
- Take the square root
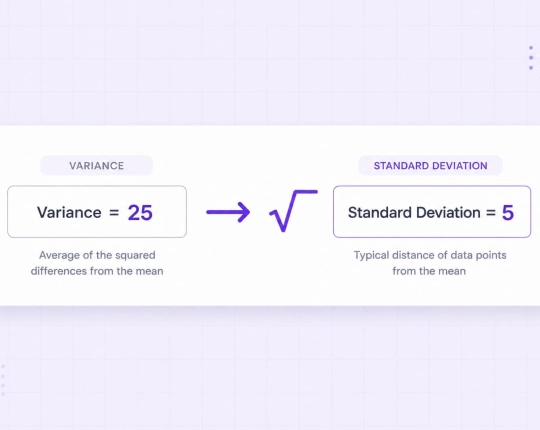
The culminating procedure generates the standard deviation that is commonly referred to as the square root of the variance. This part can be checked by a square root calculator with steps if required.

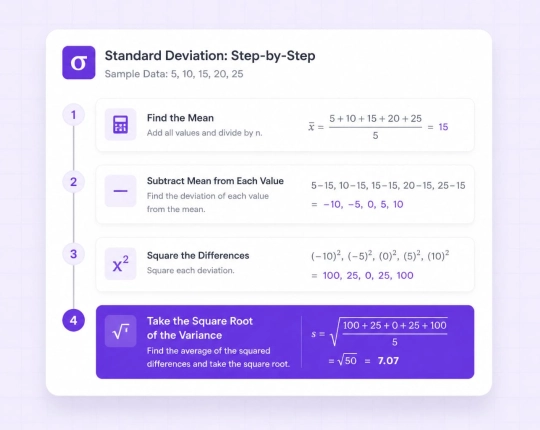
Calculate Standard Deviation Step by Step
Let us take a straightforward example. Data set: \(2, 4, 6, 8\)
Step 1: Mean value: \( \frac{2 + 4 + 6 + 8}{4} = 5 \)
Step 2: Differences from the mean: \(-3, -1, 1, 3\)
Step 3: Squared differences: \(9, 1, 1, 9\)
Step 4: Variance: \( \frac{9 + 1 + 1 + 9}{4} = 5 \)
Step 5: Square root: \( \sqrt{5} \approx 2.24 \)
The Significance of the Standard Deviation Calculator
Practically, standard deviation denotes the consistency or variability of your data.
- Finance
Price fluctuations and risk analysis rely heavily on standard deviation. A finance AI solver can extend this to portfolio analysis.
- Quality control
A standard deviation calculator helps check if a production process stays stable. It looks at data points and shows how far they are from the mean value.
- Science and research
In research, calculating the standard deviation shows how data values are spread in a data set. The tool uses squared differences and then takes the square root to get the result.
- Economics
Economic trends and forecasts depend on dispersion analysis, often supported by an economics AI solver.
Misses in the Calculation of Standard Deviation
Errors often appear during manual calculations.
- Use of wrong formula: When the population formula is applied in place of the sample formula, then wrong results are obtained.
- Arithmetic mistakes: Errors in squared differences or mean value affect the final result.
- Skipping steps: Missing the sample variance calculation produces incorrect values.
- Wrong data input: Incorrect data values distort the entire calculation.
How the Standard Deviation Calculator Works
The tool analyses your data and assists in determining whether it is a sample or a complete population. This is an important step, as each must employ a different formula.
Next, it finds the mean. Then it compares the distance of all the numbers to the mean. Squaring of these differences is done to get the variance. It is followed by taking the square root to obtain the standard deviation in the last step.
You also do not need to work through each part by hand. The full process is done in seconds, which helps avoid small mistakes in longer calculations. If you want to understand how the result was reached, the integrated math AI can explain each step in simple terms and adjust the explanation to your level.
All-in-One Math Calculators & Step-by-Step Solvers
Choose your plan
Free plan
- Unlimited use with ads included
- Free access to all AI tools
- Download all responses (answers, presentations, flashcards, etc.)
- Share responses with others
AI-Plus
- Expert reviews on discounted prices
- Ad-free experience to:
- AI detector
- Diagram generator
- PowerPoint generator
- Answer generator
- Flashcard maker
- Notes generator
- Research assistant
- Download all responses (answers, presentations, flashcards, etc.)
- Share responses with others
- Advanced reasoning
Expert help
- Presentations (human-made)
- Homework help
- STEM support
- Writing assistance
- Editing & proofreading
