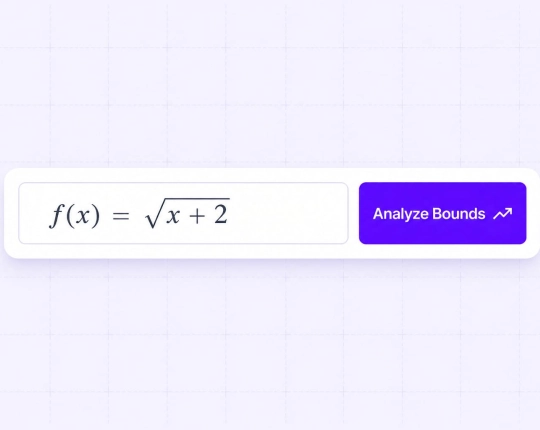
Domain and Range Graph Calculator
A Light Way to Work with Domain and Range
Handles different function types
You can evaluate a linear function, quadratic function, or rational function without changing tools.
Identifies restrictions automatically
The calculator detects undefined points such as division by zero or the root of a negative number.
Works with real numbers and intervals
It determines valid input values and possible output values using interval notation.
Supports graph-based understanding
You may imagine the behavior of the function on the graph and the domain and range of the graph.
Accurate output for complex expressions
Even functions involving fractions, powers or roots are done properly.
Lessens the misunderstanding of multi-step problems
The calculator gives a tabular response as opposed to manual verification of each restriction.
Usage of the Domain and Range Calculator


Featured in
Learning Domain and Range in Practice
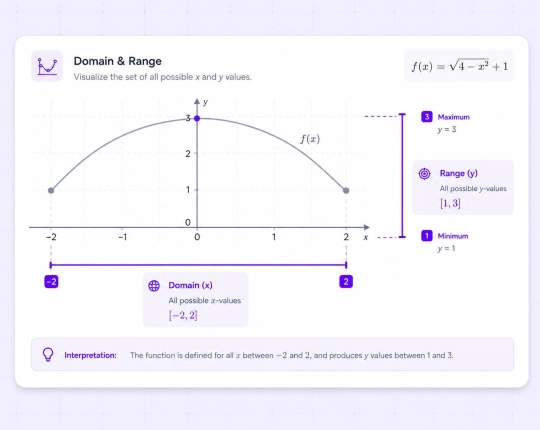
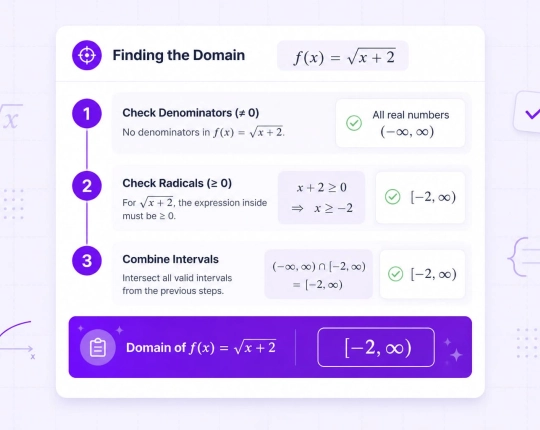
The realm of a function consists of all the input values that could make the function defined. The range describes all output values that the function can produce. For example, a square root function cannot accept a negative number under the root. This creates a restriction in the domain.
Equally, a rational function can take values off because the denominator is zero, which will be a vertical asymptote. In case you have to examine a behavior of this type in detail, a vertical asymptote calculator will be useful in determining some key points.
Common Function Types and Their Behavior
Different functions follow clear patterns when it comes to domain and range. Once you know the type of function, it becomes easier to identify valid values without guesswork.
- Linear functions: The domain includes all real numbers. The range also includes all real numbers since the graph extends infinitely in both directions.
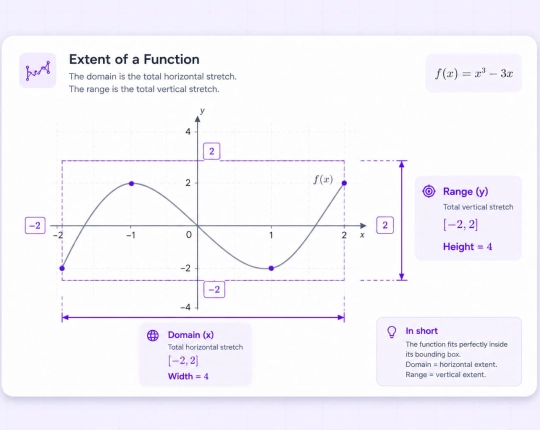
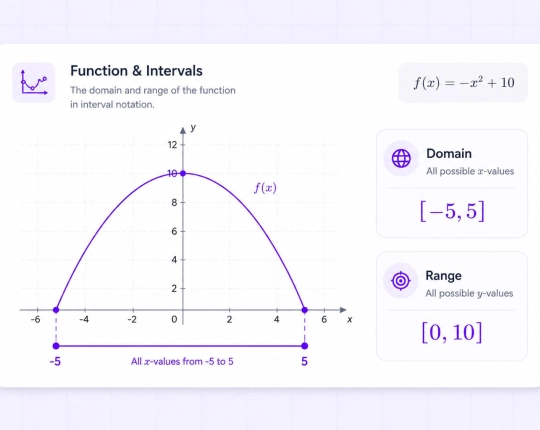
- Quadratic functions: The domain is all real numbers. The range depends on the vertex. It is limited either from a minimum point (opens up) or a maximum point (opens down).
- Rational functions: The domain excludes values that make the denominator equal to zero. These restrictions often create vertical asymptotes.
- Trigonometric functions, such as sine: These functions repeat in cycles. The domain usually includes all real numbers, but the range is limited. For sine, values stay between -1 and 1.
These patterns help you define the domain and range faster. For problems with inequalities, an inequalities calculator can help you determine valid intervals more precisely.
Graph-Based Understanding
Looking at a graph clears up domain and range issues fast. The vertical line test shows if a relation is actually a function; the curve lets you see the y values the function spits out. As an example, when the graph does not descend to a specific level, the range is limited to those that are beyond this level. Graph interpretation is especially useful when algebraic manipulation becomes complicated. If your function includes exponential growth or decay, an exponential functions calculator can help analyze its structure.
Where the Domain and Range Graph Calculator Becomes Useful
Domain and range appear in many areas beyond basic math.
- Education and algebra: Used to understand how functions behave and where they are defined.
- Calculus problems: Important when analyzing limits, derivatives, and function behavior.
- Graph analysis: Helps interpret curves and identify restrictions visually.
- Data modeling: Applied in plotting the inputs against the outputs in real-life systems.
In case your operation involves logarithmic functions, then a logarithm calculator may be used to compute them properly. More sophisticated transformations may require the help of an algebra solver to solve more complicated equations.
Share of Problems when Locating Domain and Range
Simple functions may also cause errors.
- Forgetting to exclude undefined values
- Misinterpreting square root restrictions
- Ignoring asymptotes
- Incorrect interval notation
- Confusing domain with range
Online Math Problem Solver & Calculator Suite
Choose your plan
Free plan
- Unlimited use with ads included
- Free access to all AI tools
- Download all responses (answers, presentations, flashcards, etc.)
- Share responses with others
AI-Plus
- Expert reviews on discounted prices
- Ad-free experience to:
- AI detector
- Diagram generator
- PowerPoint generator
- Answer generator
- Flashcard maker
- Notes generator
- Research assistant
- Download all responses (answers, presentations, flashcards, etc.)
- Share responses with others
- Advanced reasoning
Expert help
- Presentations (human-made)
- Homework help
- STEM support
- Writing assistance
- Editing & proofreading
